
A few weeks ago I had the opportunity to participate as a speaker at the "3rd Annual Forum on Claims and Fraud Management" organized by INESE where I was able to explain how graph analysis can help in fraud detection by providing new perspectives for analysis. In this series of posts I would like to go into the details of how insurance companies can undertake the "detection roadmap" from manual processing to network analysis to the implementation of Machine Learning algorithms. These are the phases of the "Detection Roadmap":
Fraud matrices or business rule automation
Most companies have a clear identification of the business rules that determine the risk of a given claim based on the business experience acquired in recent years.
In this way, companies determine the risk of a claim based on the conditions established in the contracted product (waiting periods, exclusions, etc.) or, based on the experience gained with suspicious claims in the past, identifying a series of rules that allow a risk indicator to be obtained based on compliance with these rules.
Some companies have moved from the identification of business rules or fraud matrix to a market-based automation of fraud or ad-hoc implementation of their claims handling systems.
- The automation of the fraud matrix brings a number of advantages:
- It allows the processing mode of the whole department to be based on the same rules avoiding subjective interpretation of the rules.
- It prevents the payment of claims that do not meet the conditions of the product or its exclusions in an automatic way.
- It brings a level of fraud risk to those claims that meet characteristics that have been determined based on the company's experience or the global experience of the sector.
Fraud matrices are a highly effective element, in fact most companies have mechanisms for automating them. However, the volume of information available to companies is growing exponentially and therefore we should be able to answer the following question: Is there any data other than that treated in the matrix that can determine the risk of a claim? To be able to answer this question, we need to enter the next step of the roadmap:
Machine Learning
Although machine learning techniques existed before the advent of BigData, it is true that this new trend allows these techniques to be more effective thanks to the ability to use all the data for training models instead of smaller samples.
Considering this premise, it is easy to imagine opportunities for improvement in the automation of the fraud matrix if, in addition to having the information coming from the processing systems, we could mix that information with the information coming from the call centers, emails, the customer's history in the company and other elements.
Having the ability to mix all of this information provides clear advantages when determining the risk of fraud in a given claim, however, many essential aspects must be taken into account to succeed in this type of approach:
- Do I have enough quality information in my systems?
- Can I improve that quality in an automated way?
- How can I access information from all the systems without altering their operation routine?
- How do we select the most relevant variables?
- How do you approach a Machine Learning project?
- How do I reduce the number of false positives?
Although I will try to answer these questions in later articles, what we can determine is that the application of Machine Learning techniques again brings a number of additional advantages:
- Increases the search range for claims with risk of fraud: The selection of new variables can determine new, hitherto unknown conditions.
- It automates the identification of risk from the application of these models.
- It provides a new indicator of fraud based on the prediction of risk through these models.
- It allows for the non-repetition of fraud we have detected in the past.
- It can reduce the number of false positives in fraud matrices.
This series of advantages can make a big difference with respect to the automation of the fraud matrix and represent a great return on investment for those insurance companies that invest in the development of these detection systems.
Up to this point in the "Detection Roadmap" we have managed to minimize the risk of re-emergence of frauds for which we have indications in the company's history, however, can we take an additional step in detecting frauds that we have never detected in the company or that we are not aware of? The following steps allow us to get closer to solving this question.
Information enrichment
One of the fundamental aspects for finding new indications of fraud risk is to have other elements of information different to those that we have in our organizations that can enrich the information that we have of our clients or of the accident itself. For this purpose, there are several catalogues of the sources of information:
Social Networks and the Internet: Society has changed radically in recent years towards digitalization. The use of social networks and blogs, among others, is a constant in almost all population age ranges, which is a great opportunity for companies if they are able to collect some of that information to enrich their own data.
Public sources: In the last few years, a multitude of freely available sources have been developed that allow us to enrich our company's information with multiple indicators such as socioeconomic values, meteorological and geopolitical values, etc. These freely available sources are determined by the Open Data currents that have been developed in recent years by governments around the world; in fact, Spain is the European leader in providing citizens with a multitude of information sources for the development of different business models.
Private sources: There are many resources that can be acquired through different associations or companies to enrich our clients' information with possible credit risk, behaviour patterns, etc. These information sources allow companies to enrich their information through inter-company agreements.
Although the availability of these sources of information to enrich our data can be a differential element in fraud detection, having this information is not exempt from multiple issues to consider:
- Is it feasible to have this information without violating the LOPD?
- What is the reliability of each of the information sources?
- What work is needed to standardize this external information and integrate it into my company's processing processes?
- What real benefit do I get from incorporating this source?
Network Analysis
One of the most creative approaches to fighting fraud or determining the risk of a particular customer or transaction is to be able to analyze information from multiple perspectives. In this sense, Graph Analysis allows us to approach fraud detection from a completely different point of view than usual, the relationship approach.
As we have seen in the previous points, most of the techniques used consist of analyzing the data from the point of view of the value of such data, however, Graph Analysis allows us to model the information from the point of view of how the information is interrelated. This new approach allows us to identify new indications of fraud based on how our clients, our claims, our data, interrelate with each other.
Graph Analysis or SNA (Social Network Analysis) is a technique that allows us to model any reality in a network formed by nodes and relationships as we can see in the following figure:
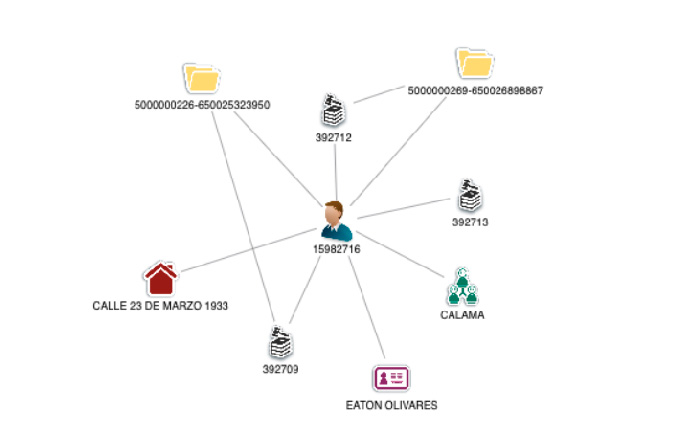
This approach allows us to speed up the investigation times of each case, based on the fact that the processors or analysts do not have to imagine a mental map of the incident but that these techniques provide us with a completely visual approach to the information.
On the other hand, Graph Analysis applied to the data of an insurance company allows us to know the behaviour of our clients in each of the company's claims and thus identify new indications as common elements between different claims, the appearance of organized networks of fraud, the detection of time sequences or geographical patterns. In other words, given that fraud is committed by people, we use information modelling that allows us to "see" how these people interrelate.
But Graphics Analysis is not only a visualization or modeling mode, it also allows us to apply different mathematical techniques and algorithms that allow us
to infer behavior patterns in our clients as a whole or anomalies found in our data in an automated way.
In my opinion, detecting fraud or determining the risk of a certain profile is a really complex task and there are no foolproof systems. However, the use of Graph Analytics together with Machine Learning and information enrichment provides a differentiating element in the fight against fraud and can generate significant benefits for a company that decides to undertake such a roadmap.