
It is increasingly common to use learning algorithms that provide programs with sufficient intelligence to predict, recommend or classify elements. Some examples of applications that use this type of recommendation system are Netflix or Spotify, which recommend films or songs that could interest users according to their tastes.
Spark MLlib
I have already told you about Apache Spark in my article Apache Spark: Introduction to Spark Sql, but today I want to go deeper into its MLlib library designed to implement and train Machine Learning models in an easy way.
In general, Machine Learning algorithms can be classified into two types:
- Supervised: these algorithms are trained with a set of data whose result is already known. That is, the model is trained with data for which the input and output is already known.
- Unsupervised: the model is trained with data for which the result is not yet known. That is, the input is known but not the output.
Spark MLlib provides both supervised and unsupervised learning algorithms that offer solutions to the three most used techniques in the world of Machine Learning:
- Classification and regression: Supervised algorithms that classify or predict values: Multilayer perceptron classifier, Decision trees, Random forest.
- Clustering: Unsupervised algorithms that group data into different clusters based on the similarity between them: K-means, LDA and GMM
- Collaborative filtering: Recommendation techniques based on user preference data: ALS
Example of clustering
I don't intend to go into detail about the operation of each of the algorithms that Spark provides us with. Instead, I'd like to give you an example of K-means to show you how easy it can be to train a model with Spark. For the implementation I have relied on Apache Zeppelin, which allows the exploration of the data in an easier way and provides a visual interface with which to display graphs.
As input data used for the model training, a CSV file containing information on noise pollution collected in the city of Madrid during the years 2016 and 2017 has been used. This is the information contained in the data set, where each row of the CSV file contains:
| Fact | Data content |
|---|---|
| Date | Date of action |
| Ld | A-weighted long-term average sound level, determined over all day periods (7 a.m. to 7 p.m.) of the month. |
| The | A-weighted long-term average sound level, determined over all late periods (7 to 11 p.m.) of the month. |
| Ln | A-weighted long-term average sound level, defined as determined over all the night periods (from 11 p.m. to 7 a.m.) of the month. |
| LAeq24 | A-weighted long-term average sound level, determined over all daily periods (24 hours) of the month |
First the data was read from the file, cleaned up and transformed into a DataFrame:
import org.apache.spark.ml.clustering.KMeans
import org.apache.spark.ml.feature.VectorAssembler

case class AcousticData(date: String, ld: Double, le: Double, ln: Double, lAeq: Double)

// Create DataFrame from CSV file
val acousticDF = sc.textFile("/home/dgrana/BigData/Acoustic_2016-17.csv")
  .filter(x => !(x.contains("Fecha") || x.contains("N/D") || x.split(";").length<5))
    .map({
        line =>
            val row = line.split(";")
            AcousticData(
                row(0),
                row(1).replace(",",".").toDouble,
                row(2).replace(",",".").toDouble,
                row(3).replace(",",".").toDouble,
                row(4).replace(",",".").toDouble
            )
    }).toDF()

acousticDF.createOrReplaceTempView("ACOUSTIC_DATA")
Once the DataFrame is obtained, the model is trained with a K-means algorithm, indicating that it clusters the data in five different clusters. In addition, we create a table with the results of the prediction:
// Asembler to create a features vector
val assemblerKmeans = new VectorAssembler().setInputCols(Array("ld","le","ln","lAeq"))
  .setOutputCol("features")

// Set the features column
val vd = assemblerKmeans.transform(acousticDF)

// Trains a k-means model.
val kmeans = new KMeans().setK(5).setSeed(1L)
val model = kmeans.fit(vd)

// Evaluate clustering by computing Within Set Sum of Squared Errors.
val WSSSE = model.computeCost(vd)
println(s"Within Set Sum of Squared Errors = $WSSSE")

val predictions = model.transform(vd)
predictions.createOrReplaceTempView("ACOUSTIC_DATA_KMEANS")
Finally, the results obtained are checked:
SELECT prediction, count(*) from ACOUSTIC_DATA_KMEANS group by 1The aim of this example is to cluster the collected sound levels according to their similarity.
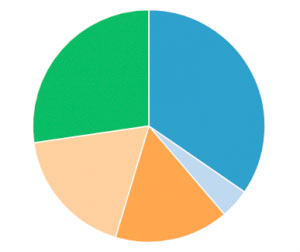
As you can see in the image, the data have been clustered based on their similarity. The resulting clustering is irregular, as there is a considerably smaller cluster than the rest. If considered small enough, the values that have been classified in that cluster can be considered outliers or outliers that can reference abnormal sound level data. But to draw this kind of conclusion it is necessary to go deeper in the analysis of the data.
Data analysis with Spark MLlib
Spark MLlib provides us with a simple and scalable way to train and apply different Machine Learning models and algorithms to our data, extracting all the value from them, without the need for complex analysis tools, or large custom developments.